


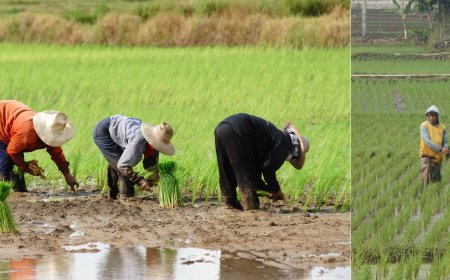


Kharif 2025: Expansion in Rice & Maize, Decline in Soybean & Cotton
According to the latest Ministry of Agriculture data, Kharif 2025 witnessed a notable increase in rice and maize sowing, while soybean and cotton acreage declined.
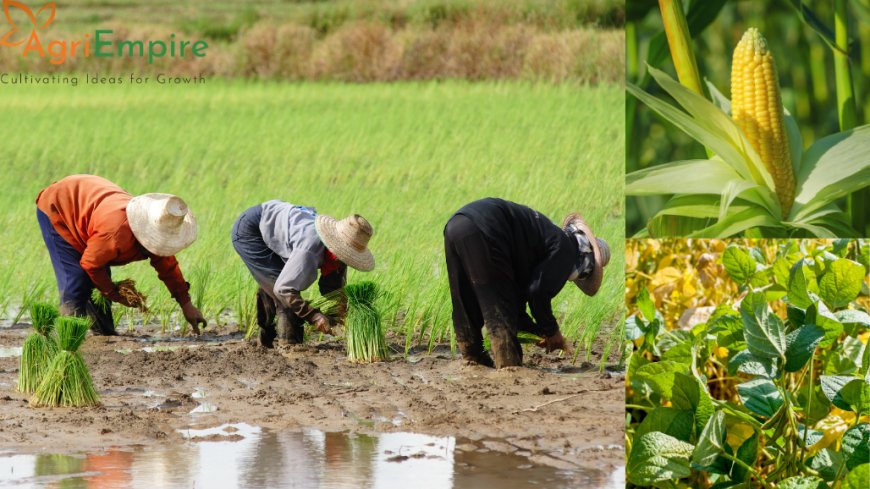
According to the Progressive Crop Area Sown Report released on August 22, 2025, the total area under Kharif crops in 2025 increased by 35.40 lakh hectares (a 3% growth). Notably, rice and maize sowing expanded significantly, while soybean and cotton acreage declined.
-
Rice: 390.80 → 420.41 lakh ha (↑ 8%)
-
Maize: 83.58 → 93.34 lakh ha (↑ 12%)
-
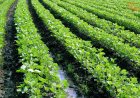
Soybean: 124.88 → 120.11 lakh ha (↓ 4%)
-
Cotton: 111.39 → 108.47 lakh ha (↓ 3%)
-
Summary: Overall acreage rose, but key oilseed and cash crops saw declines.
The increase in rice sowing likely stems from favorable monsoon patterns, government MSP support, and procurement policies. Maize’s rapid growth is driven by its stable returns and demand from feed and starch industries. Conversely, soybean and cotton appear impacted by higher costs, climate-related uncertainties, and shifting farmer preferences. These trends underscore the need for balanced policy and market strategies going forward.
All India: Progressive Crop Area Sown Report – Kharif 2025
| Crops | Normal (DA&FW) | Area Sown 2025-26 | Area Sown 2024-25 | Difference (Lakh Ha) | Growth |
|---|---|---|---|---|---|
| Rice | 403.09 | 420.41 | 390.80 | 29.60 | 8% |
| Total Pulses | 129.61 | 112.77 | 111.42 | 1.34 | 1% |
| Tur | 44.71 | 43.98 | 44.77 | -0.78 | -2% |
| Kulthi | 1.72 | 0.26 | 0.23 | 0.04 | 13% |
| Urad | 32.64 | 21.71 | 20.31 | 1.39 | 7% |
| Moong | 35.69 | 33.95 | 33.50 | 0.45 | 1% |
| Other Pulses | 5.15 | 3.70 | 3.50 | 0.19 | 6% |
| Moth Bean | 9.70 | 9.17 | 9.11 | 0.05 | 1% |
| Total Coarse Cereals | 180.71 | 187.12 | 175.93 | 11.18 | 6% |
| Jowar | 15.07 | 13.90 | 13.98 | -0.08 | -1% |
| Bajra | 70.69 | 67.20 | 66.90 | 0.30 | 0% |
| Ragi | 11.52 | 7.99 | 7.27 | 0.72 | 10% |
| Maize | 78.95 | 93.34 | 83.58 | 9.76 | 12% |
| Other Small Millets | 4.48 | 4.68 | 4.20 | 0.49 | 11% |
| Total Oilseeds | 194.63 | 182.38 | 187.64 | -5.26 | -3% |
| Groundnut | 45.10 | 45.30 | 46.56 | -1.25 | -3% |
| Sesamum | 10.32 | 9.83 | 10.46 | -0.63 | -6% |
| Sunflower | 1.29 | 0.63 | 0.69 | -0.06 | -9% |
| Soybean | 127.19 | 120.11 | 124.88 | -4.77 | -4% |
| Nigerseed | 1.08 | 0.36 | 0.31 | 0.06 | 16% |
| Castorseed | 9.65 | 6.09 | 4.68 | 1.41 | 30% |
| Other Oilseeds | — | 0.06 | 0.07 | -0.01 | -14% |
| Sugarcane | 52.51 | 57.31 | 55.68 | 1.64 | 3% |
| Jute & Mesta | 6.60 | 5.54 | 5.72 | -0.19 | -3% |
| Cotton | 129.50 | 108.47 | 111.39 | -2.92 | -3% |
| Grand Total | 1096.65 | 1073.98 | 1038.58 | 35.40 | 3% |